COVID-19 pandemic has affected the vast majority of nations around the world. However, different countries have experienced different trajectories of growth in coronavirus infections. In India also, the pandemic is showing a growing trajectory currently despite a late start. In this article, I analyze the early phase of growth of the pandemic in selected countries in terms of growth of the total number of cases and total number of deaths with time and examine how they compare with the current phase of growth of the cases in India. Such a comparison might be helpful in understanding the future trends of growth of the pandemic in India and the steps to be taken to contain its spread or ‘flatten’ the curve.
As the coronavirus cases in India have recently crossed 3,000, I take this figure for comparing the early phase of growth in selected countries and compare the number of days taken to reach 3,000 cases from the first 100 cases. I select ten countries for comparison based on the highest number of confirmed cases as on April 4, 2020 (I have excluded China as comparable data on the early phase of growth in that country are not available). For easier comparison, I take five countries each in two groups along with India in each group. In the first set, I examine the early phase of growth in USA, Italy, Spain, Germany and France with that of India to compare the number of days taken for the cases to reach 3,000 from an initial level of 100. This is depicted in the Fig. 1. As can be seen, it has taken 21 days in India for the cases to grow from 100 to 3,000. A significant part of the rise in cases in India has occurred in the last 3-4 days of this period, which has been linked to the Tablighi-Jamaat event in Delhi [1], [2]. However, the time taken in India to reach this level of cases is still much longer when compared to the duration for the same number of cases in the other countries in the group showing that the curve has been much ‘flatter’ in India.
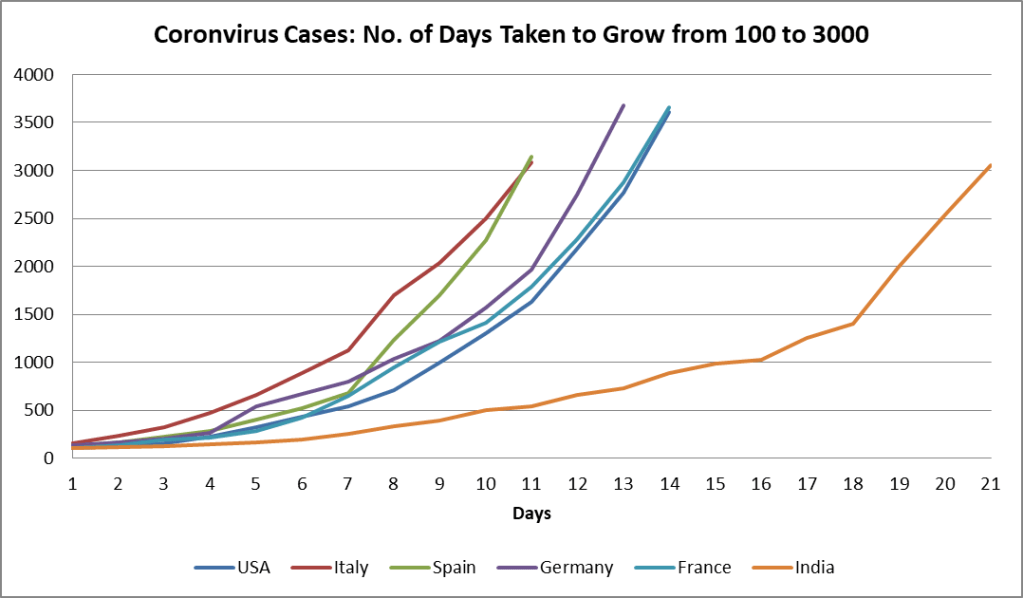
Fig.1: Coronavirus cases in select countries – No. of days taken to grow from 100 to 3000
Source: The author, with data from https://www.worldometers.info/coronavirus/ (accessed on April 4, 2020).
Fig. 2 depicts the same comparison with the other five countries in the group, namely Iran, UK, Turkey, Switzerland and Belgium. Again, we can see that the growth trajectory of the cases has been much steeper in all these countries when compared to the same for India.

Fig.2: Coronavirus cases in select countries – No. of days taken to grow from 100 to 3000
Source: The author, with data from https://www.worldometers.info/coronavirus/ (accessed on April 4, 2020).
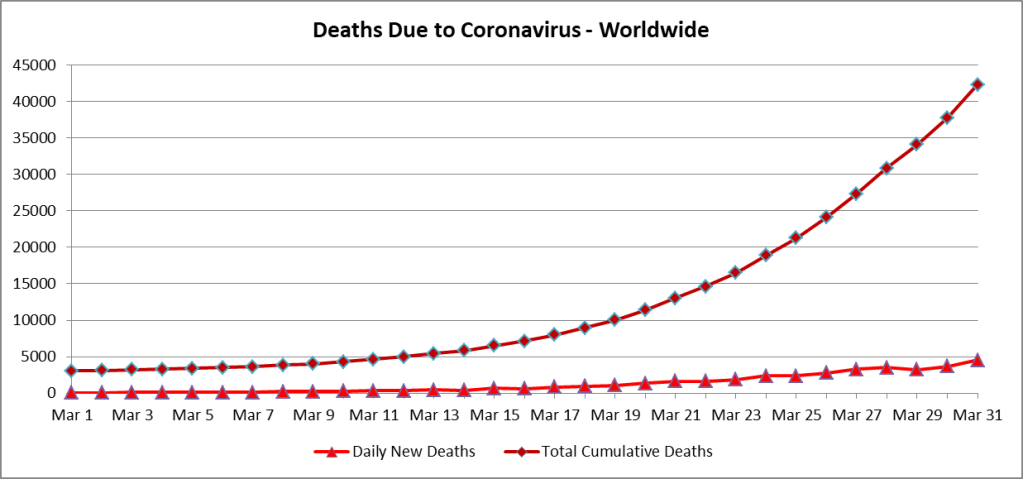
Trends in Deaths Due to Coronavirus
It is also helpful to understand the growth trends in deaths occurring in the above countries due to COVID-19. As the number of deaths due to coronavirus in India has crossed 50 recently, I take this figure for comparative analysis of the selected countries for the number of days taken for the deaths to reach 50 starting from the first death. Fig. 3 depicts this trend. As can be observed, France is the only country in this group that has taken more days than India to cross the first 50 deaths. However, the growth rate of deaths has been much steeper in France after this stage.

Fig.3: Deaths due to coronavirus in select countries – No. of days taken to reach first 50 deaths.
Source: The author, with data from https://www.worldometers.info/coronavirus/ (accessed on April 5, 2020).
Fig. 4 below depicts the same comparative picture for the second group of countries comprising Iran, UK, Turkey, Switzerland and Belgium. As we can see, the growth trajectory of the total deaths in all these countries has been significantly steeper than that in India.
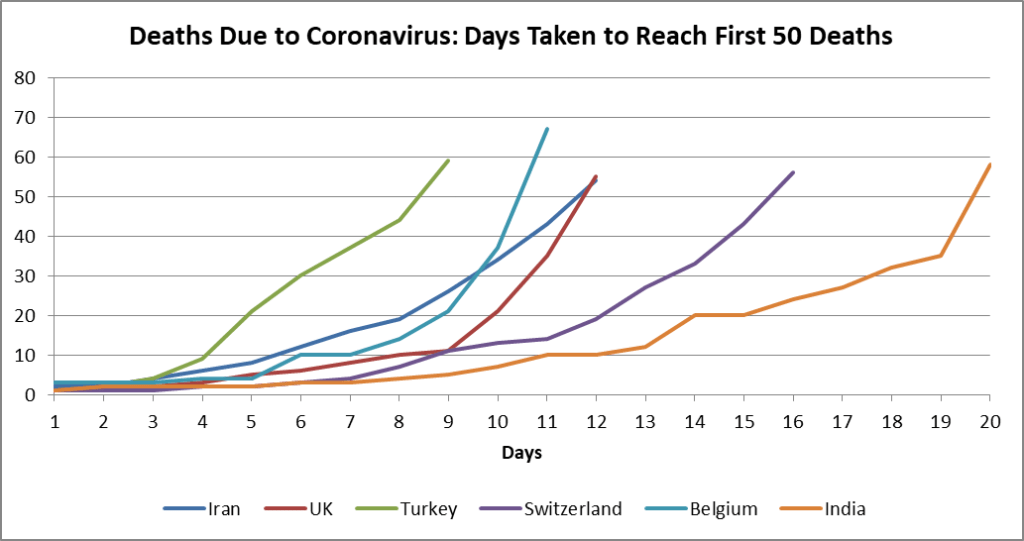
Fig.4: Deaths due to coronavirus in select countries – No. of days taken to reach first 50 deaths.
Source: The author, with data from https://www.worldometers.info/coronavirus/ (accessed on April 5, 2020).
As the analysis above shows, at this stage, the growth trajectory of the pandemic in terms of both the total number of cases and the total number of deaths looks significantly flatter in India when compared to the same during the early phases in the above selected countries. It is relevant to note here that I have not examined the impact of the lockdown on the growth of the cases as comparable data on the impact of lockdowns from the above selected countries during the early phase of the pandemic are not available.
References:
- https://www.ndtv.com/india-news/coronavirus-tablighi-jamaat-30-per-cent-of-coronavirus-cases-linked-to-delhi-mosque-event-government-2206163 (accessed on April 6, 2020).
- https://www.washingtonpost.com/world/asia_pacific/india-coronavirus-tablighi-jamaat-delhi/2020/04/02/abdc5af0-7386-11ea-ad9b-254ec99993bc_story.html (accessed on April 6, 2020).
(The views expressed in this article are personal).